This is going to be a long post, because your ride file is very interesting, and there is a lot to learn from it

You're riding on a track, so average slope should always be zero. However, there is a drift in slope values; it is easy to see in the ride file in the slope graph at the bottom
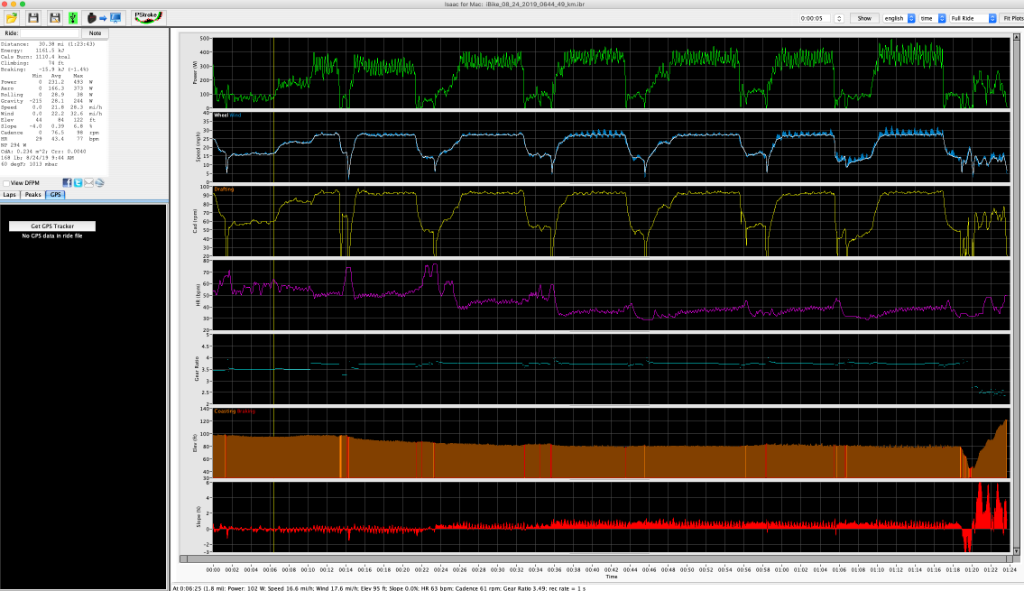
- Screen Shot 2019-08-25 at 9.49.23 AM.png (180.89 KiB) Viewed 3416 times
Slope change could be a result of sensor drift, or it could also be caused by changes in bike flex. We have been testing a firmware update to address this phenomenon, which hopefully we will release soon.
Also, you correctly point out that in some of the tests, test 6 in particular, there is a non-zero net wind, even though you are on a track. I suspect something changed in your ride position that altered the flow of air around the pitot tube.
The good news is that you can do some pretty cool things in Isaac to workaround these problems and give you solid results. It takes a bit of time, but it really works! (We hope to automate much of this in the next release of Isaac, but you can do it manually right now)
Here is the process:
1) You have 6 tests, each about six minutes long. I highlight each test separately (where speed is stable during the test), then use the command “File/Combine-Split/Keep Selection Only” to create 6 files, each having the test data only. I name them Test 1, Test 2, etc.
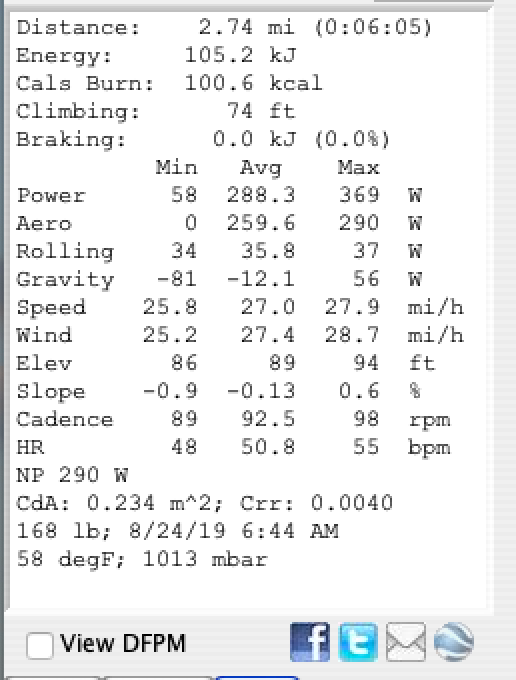
2) I open each file (for example, Test 1). Since you are in a closed loop, average wind speed should be the same as average bike speed, and average slope should be zero. I observe that wind speed (27.4) is a bit higher than bike speed (27.0), and average slope is -0.13%.
- Screen Shot 2019-08-25 at 10.09.36 AM.png (60.66 KiB) Viewed 3416 times
So, Test 1 definitely needs some tweaking!
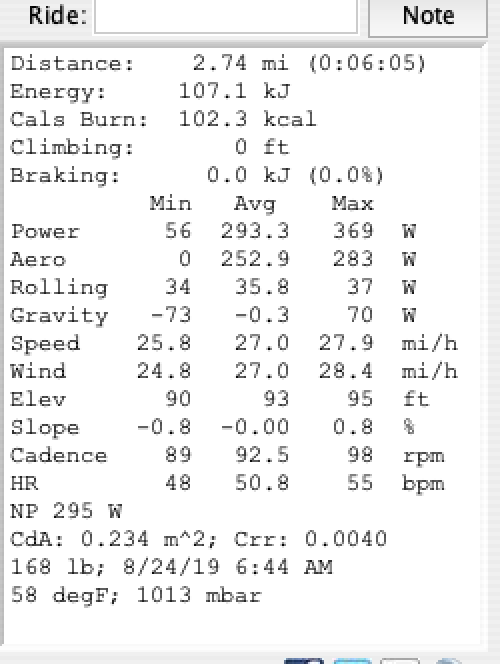
3) To correct the slope and wind errors I use the “Analyze/Analyze Route” command, which corrects for slope drift and non-zero net wind speed. After analysis the average wind speed is 27.0 and the average slope is 0.00%. So, we now have a good set of test data.
- Screen Shot 2019-08-25 at 10.11.40 AM.png (46.57 KiB) Viewed 3416 times
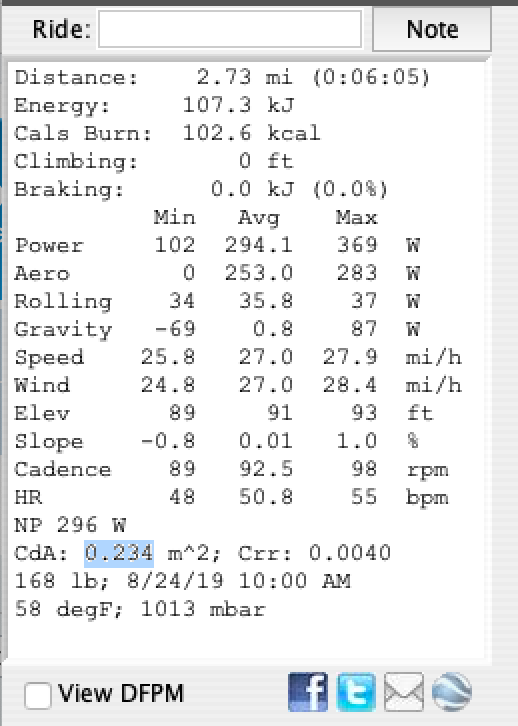
4) To obtain the actual CdA from the test (and this is where it gets a bit tedious, sorry), I notice that your average AP watts (293.3) are too high compared to average DFPM watts (258.6);
this means that CdA has to be reduced from the assumed default value of 0.234.
- Screen Shot 2019-08-25 at 9.55.23 AM.png (59.68 KiB) Viewed 3416 times
I use the command "Analyze/Tweak CdA", and then I GUESS a lower value of CdA. Lower CdA will reduce AP watts. My first guess of 0.200 lowers AP watts to 256.8—two watts too low.
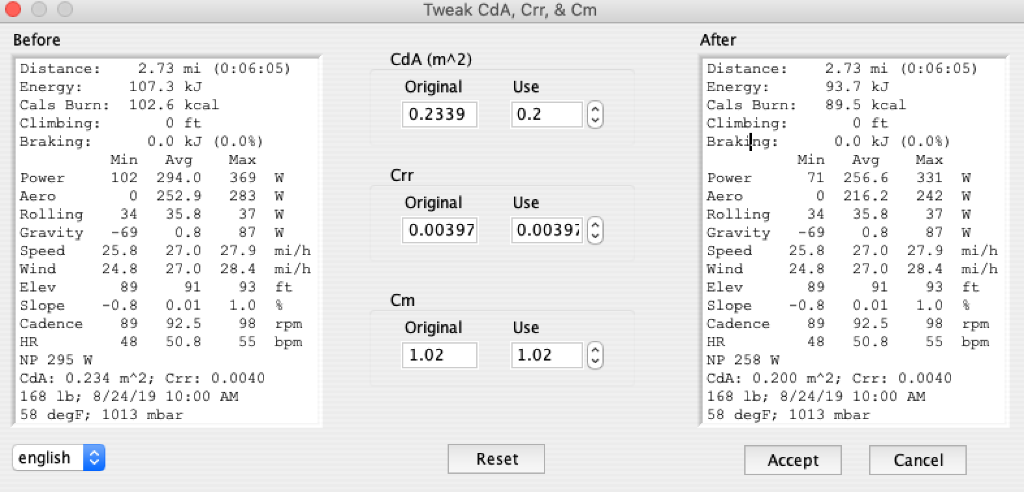
- Screen Shot 2019-08-25 at 9.57.28 AM.png (129.18 KiB) Viewed 3416 times
My second guess is 0.202—high by about 0.2W.

- Screen Shot 2019-08-25 at 9.58.11 AM.png (145.89 KiB) Viewed 3416 times
I go to 0.201, now about 1W low.
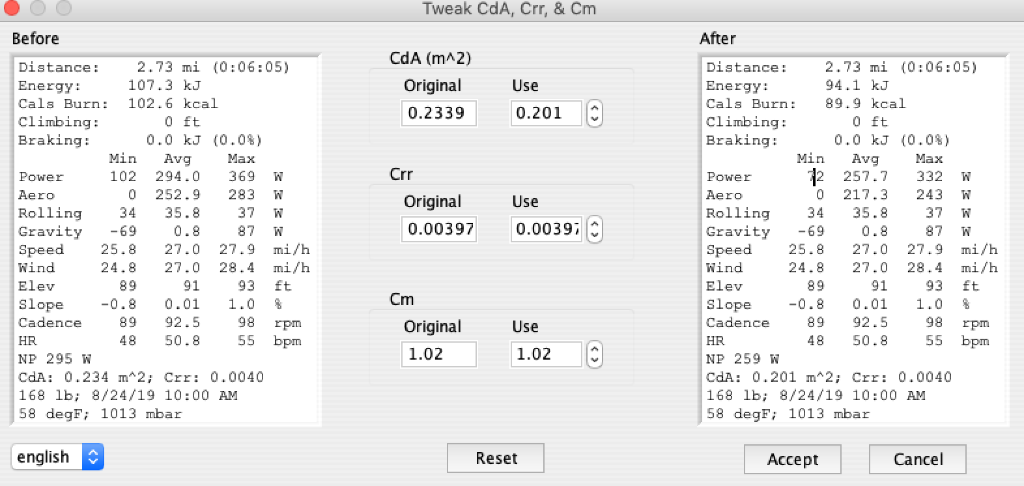
- Screen Shot 2019-08-25 at 9.58.55 AM.png (145.25 KiB) Viewed 3416 times
So, interpolating between the two,
the CdA for Test 1 is 0.2019 . I save this file as “Test 1_Corr”
5)
Notice that, to get the last bit of CdA resolution, I am interpolating the fourth digit.
6) I repeat this sequence for each of the other 5 tests. Here is what I get
Test 1 CdA = 0.2019
Test 2 CdA = 0.1998
Test 3 CdA = 0.1998
Test 4 CdA = 0.1937
Test 5 CdA = 0.1956
Test 6 CdA = 0.1993
Ride files are attached.
OK, so what does all this mean?
A. CdA is a very sensitive measurement! We are trying to make measurements down to a difference of 0.1W--to achieve that level of resolution requires that everything be properly calibrated.
B. Getting the highest resolution of CdA measurement requires post-ride analysis using Isaac
C. The lower the CdA, the less power is required to maintain the same speed
D. The “4th digit” of CdA represents wattage differences of only about 0.1W; for example, when comparing Test 3 (0.1998) to Test 6 (0.1996), Test 6 yields only about a 0.5W aerodynamic advantage
E. The biggest drop in CdA comes when comparing Test 1 (0.2019) to Test 4 (0.1937). To quantify the power difference between these tests, for Test 1 I use the Analyze/Tweak CdA command and enter the number 0.194. Watts drop from 258.8 to 250.0.
This means that Test 4 saves about 9W compared to Test 1—that is a 4.4% power improvement due to improved aerodynamics!
We are working on changes to Isaac that will make this analysis process easier, but in the mean time, this process really works!