The data is really interesting, and helpful to understanding better what is going on:
1) In the saddle, your PowerStroke looks good: 3 cm side to side, 1 cm front-to-back, 8 wasted watts
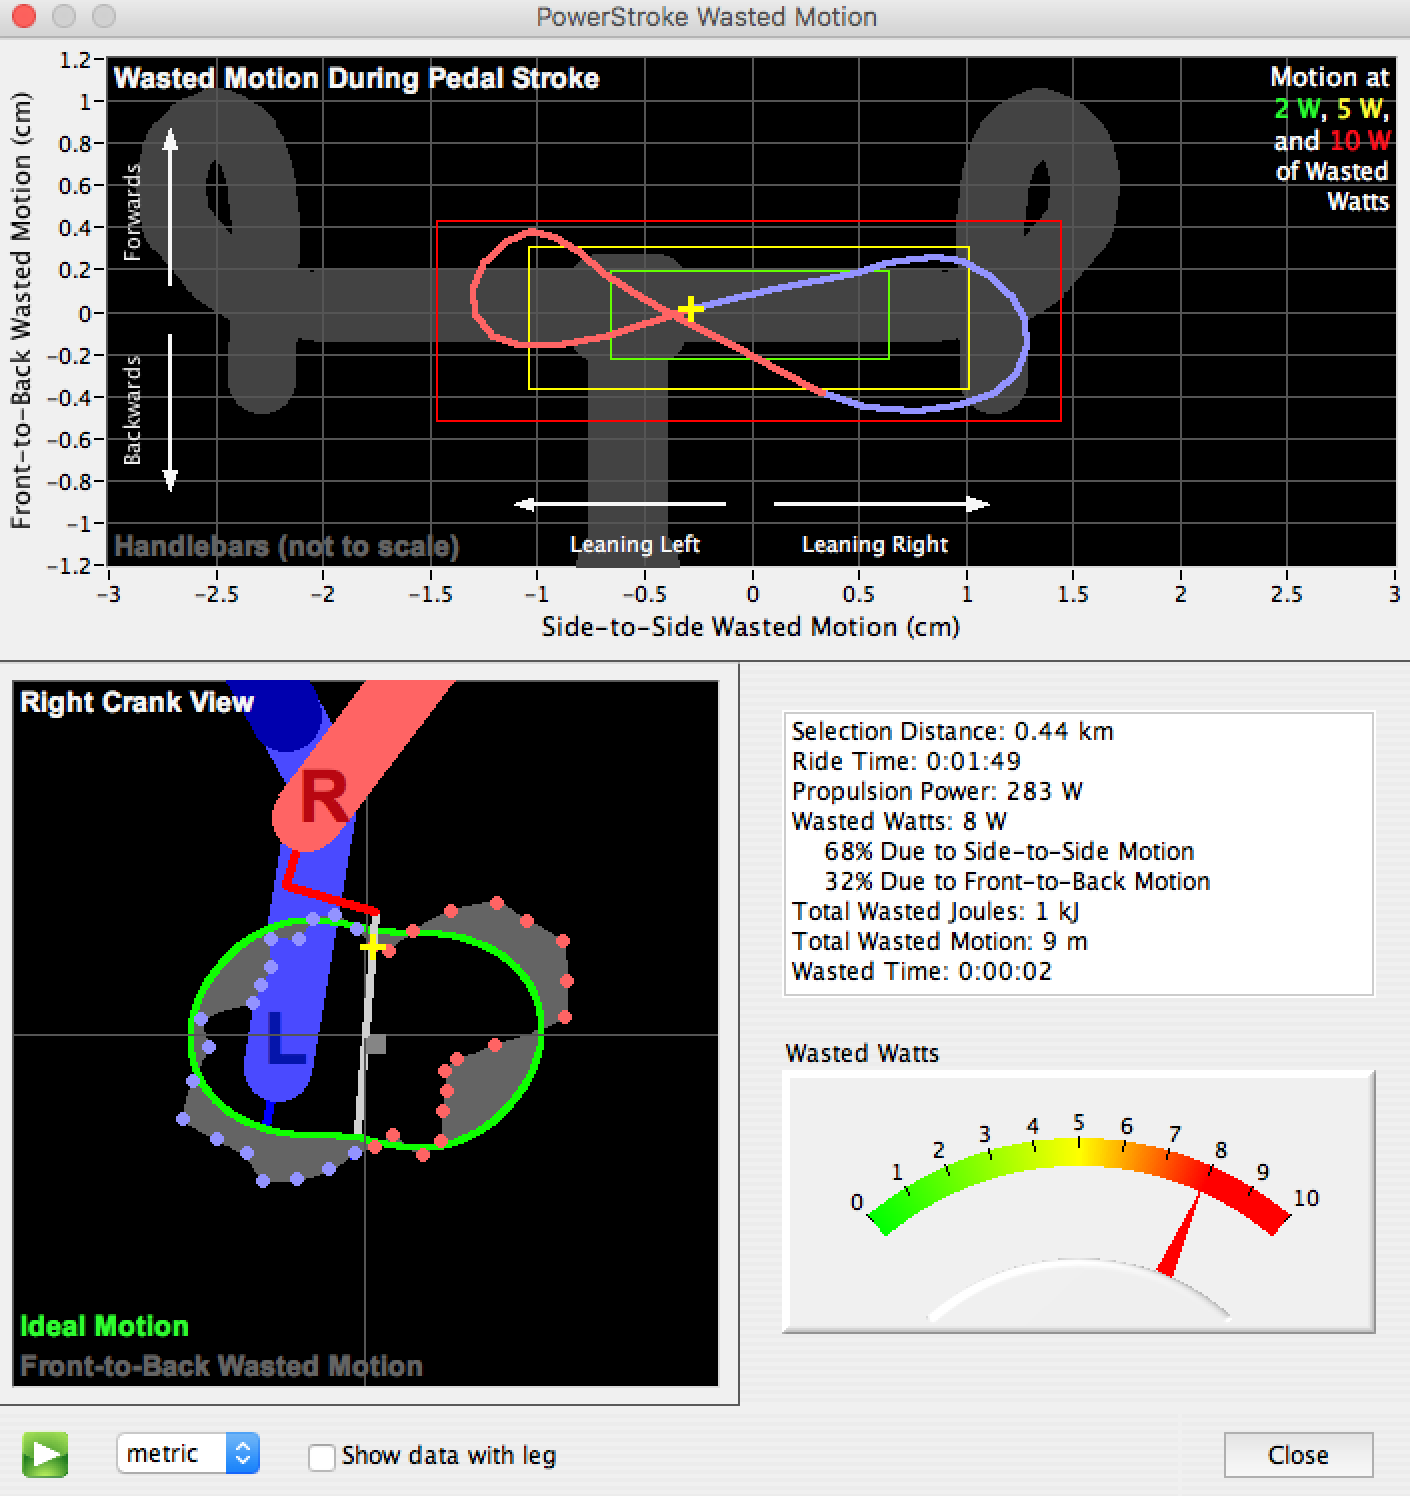
- In-the-saddle PowerStroke
- Screen Shot 2017-08-13 at 2.51.25 PM.png (209.4 KiB) Viewed 27379 times
2) When out of the saddle you have a
huge 14 cm side-to-side sway and 6 cm front-to-back sway; honestly, the largest sway I've ever seen in a ride file, by at least a factor of 3.
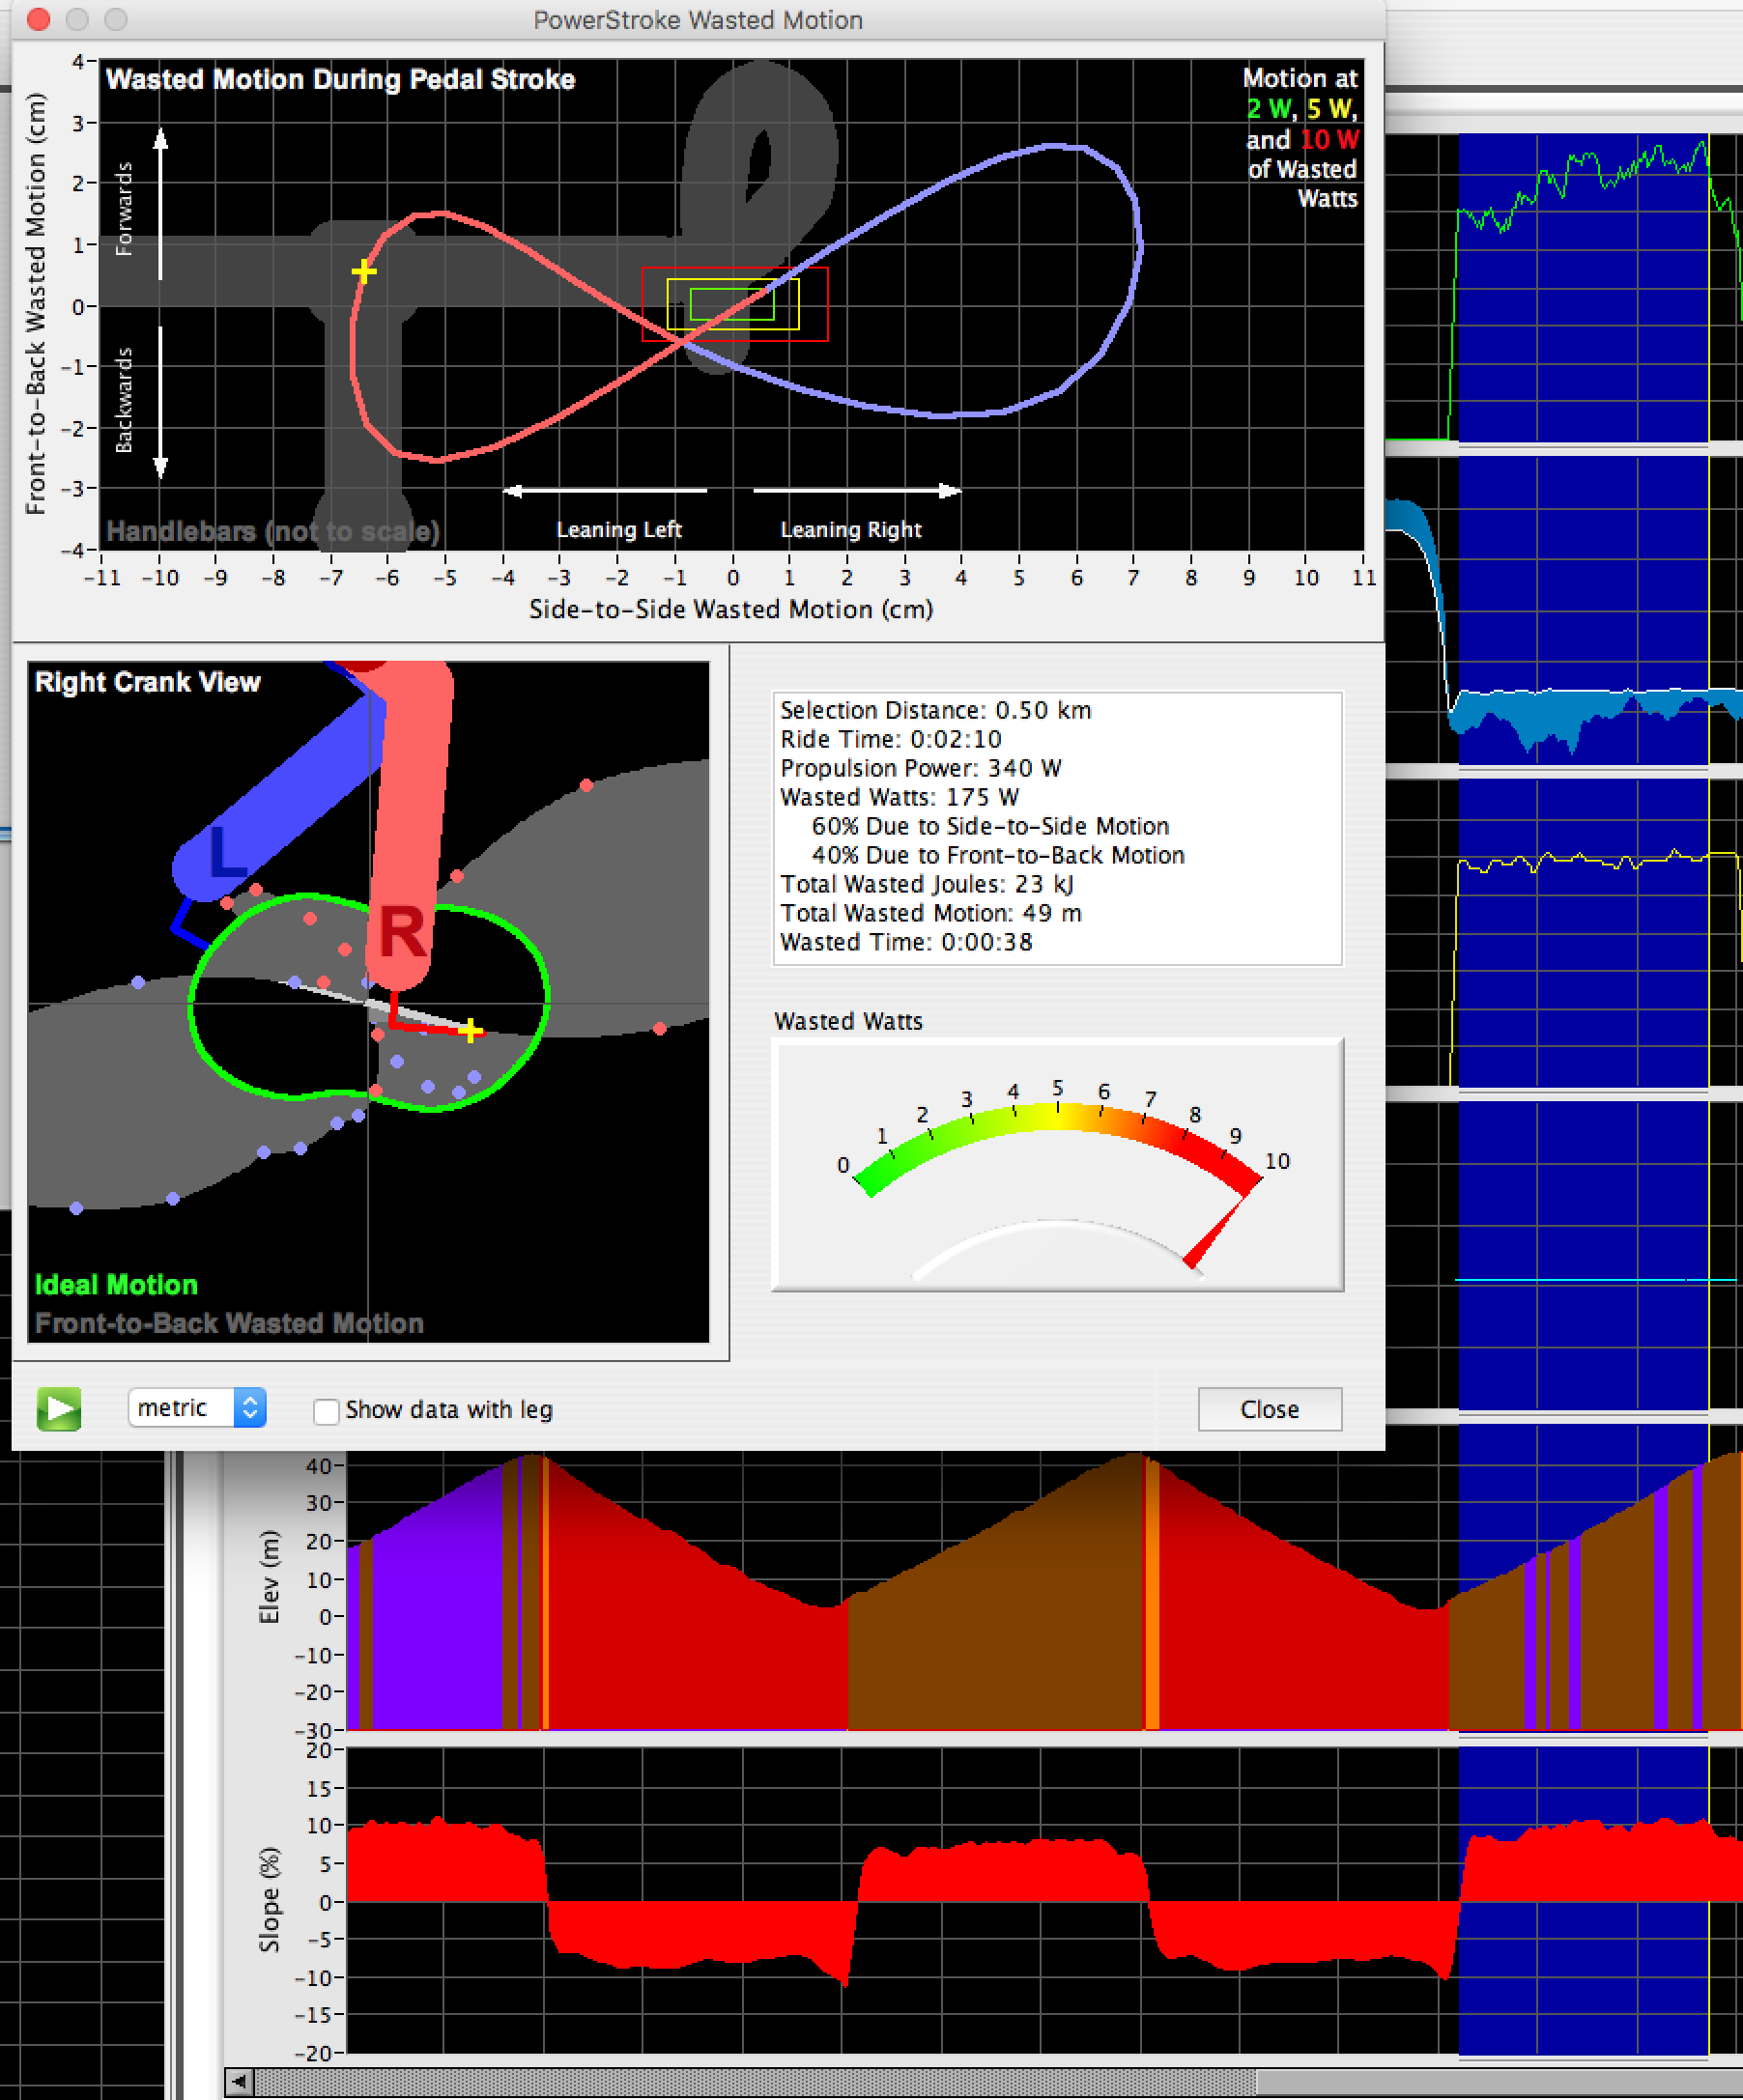
- Hill 3
- Screen Shot 2017-08-13 at 2.24.53 PM.png (362.01 KiB) Viewed 27379 times
The impact of such a large sway on accelerometer readings is something we have not previously studied, but obviously it is having a material effect. Such a large sway may also be having an adverse effect on your riding efficiency. PowerStroke is estimating 175W of wasted watts (I don't think it is really that much, but it is definitely something to look at)
3) When using PP for slope measurement comparisons, it is extremely important to pick locations where the slope is not changing, and where bike speed is constant. You have some good data available that satisfies both conditions. You can see a clear break (reduction) in watts near the top of the hill. This is where slope goes down slightly. However, for the prior 430 meters, slope is nearly constant, and you've done a great job of holding constant bike speed (no bike acceleration effect). So, this section of the hill is perfect for slope measurement comparisons. (The data in hill 1 is OK, but nearly perfect for hills 3 and 5). Of course, the out-of saddle data on hills 2 and 4 is not used...

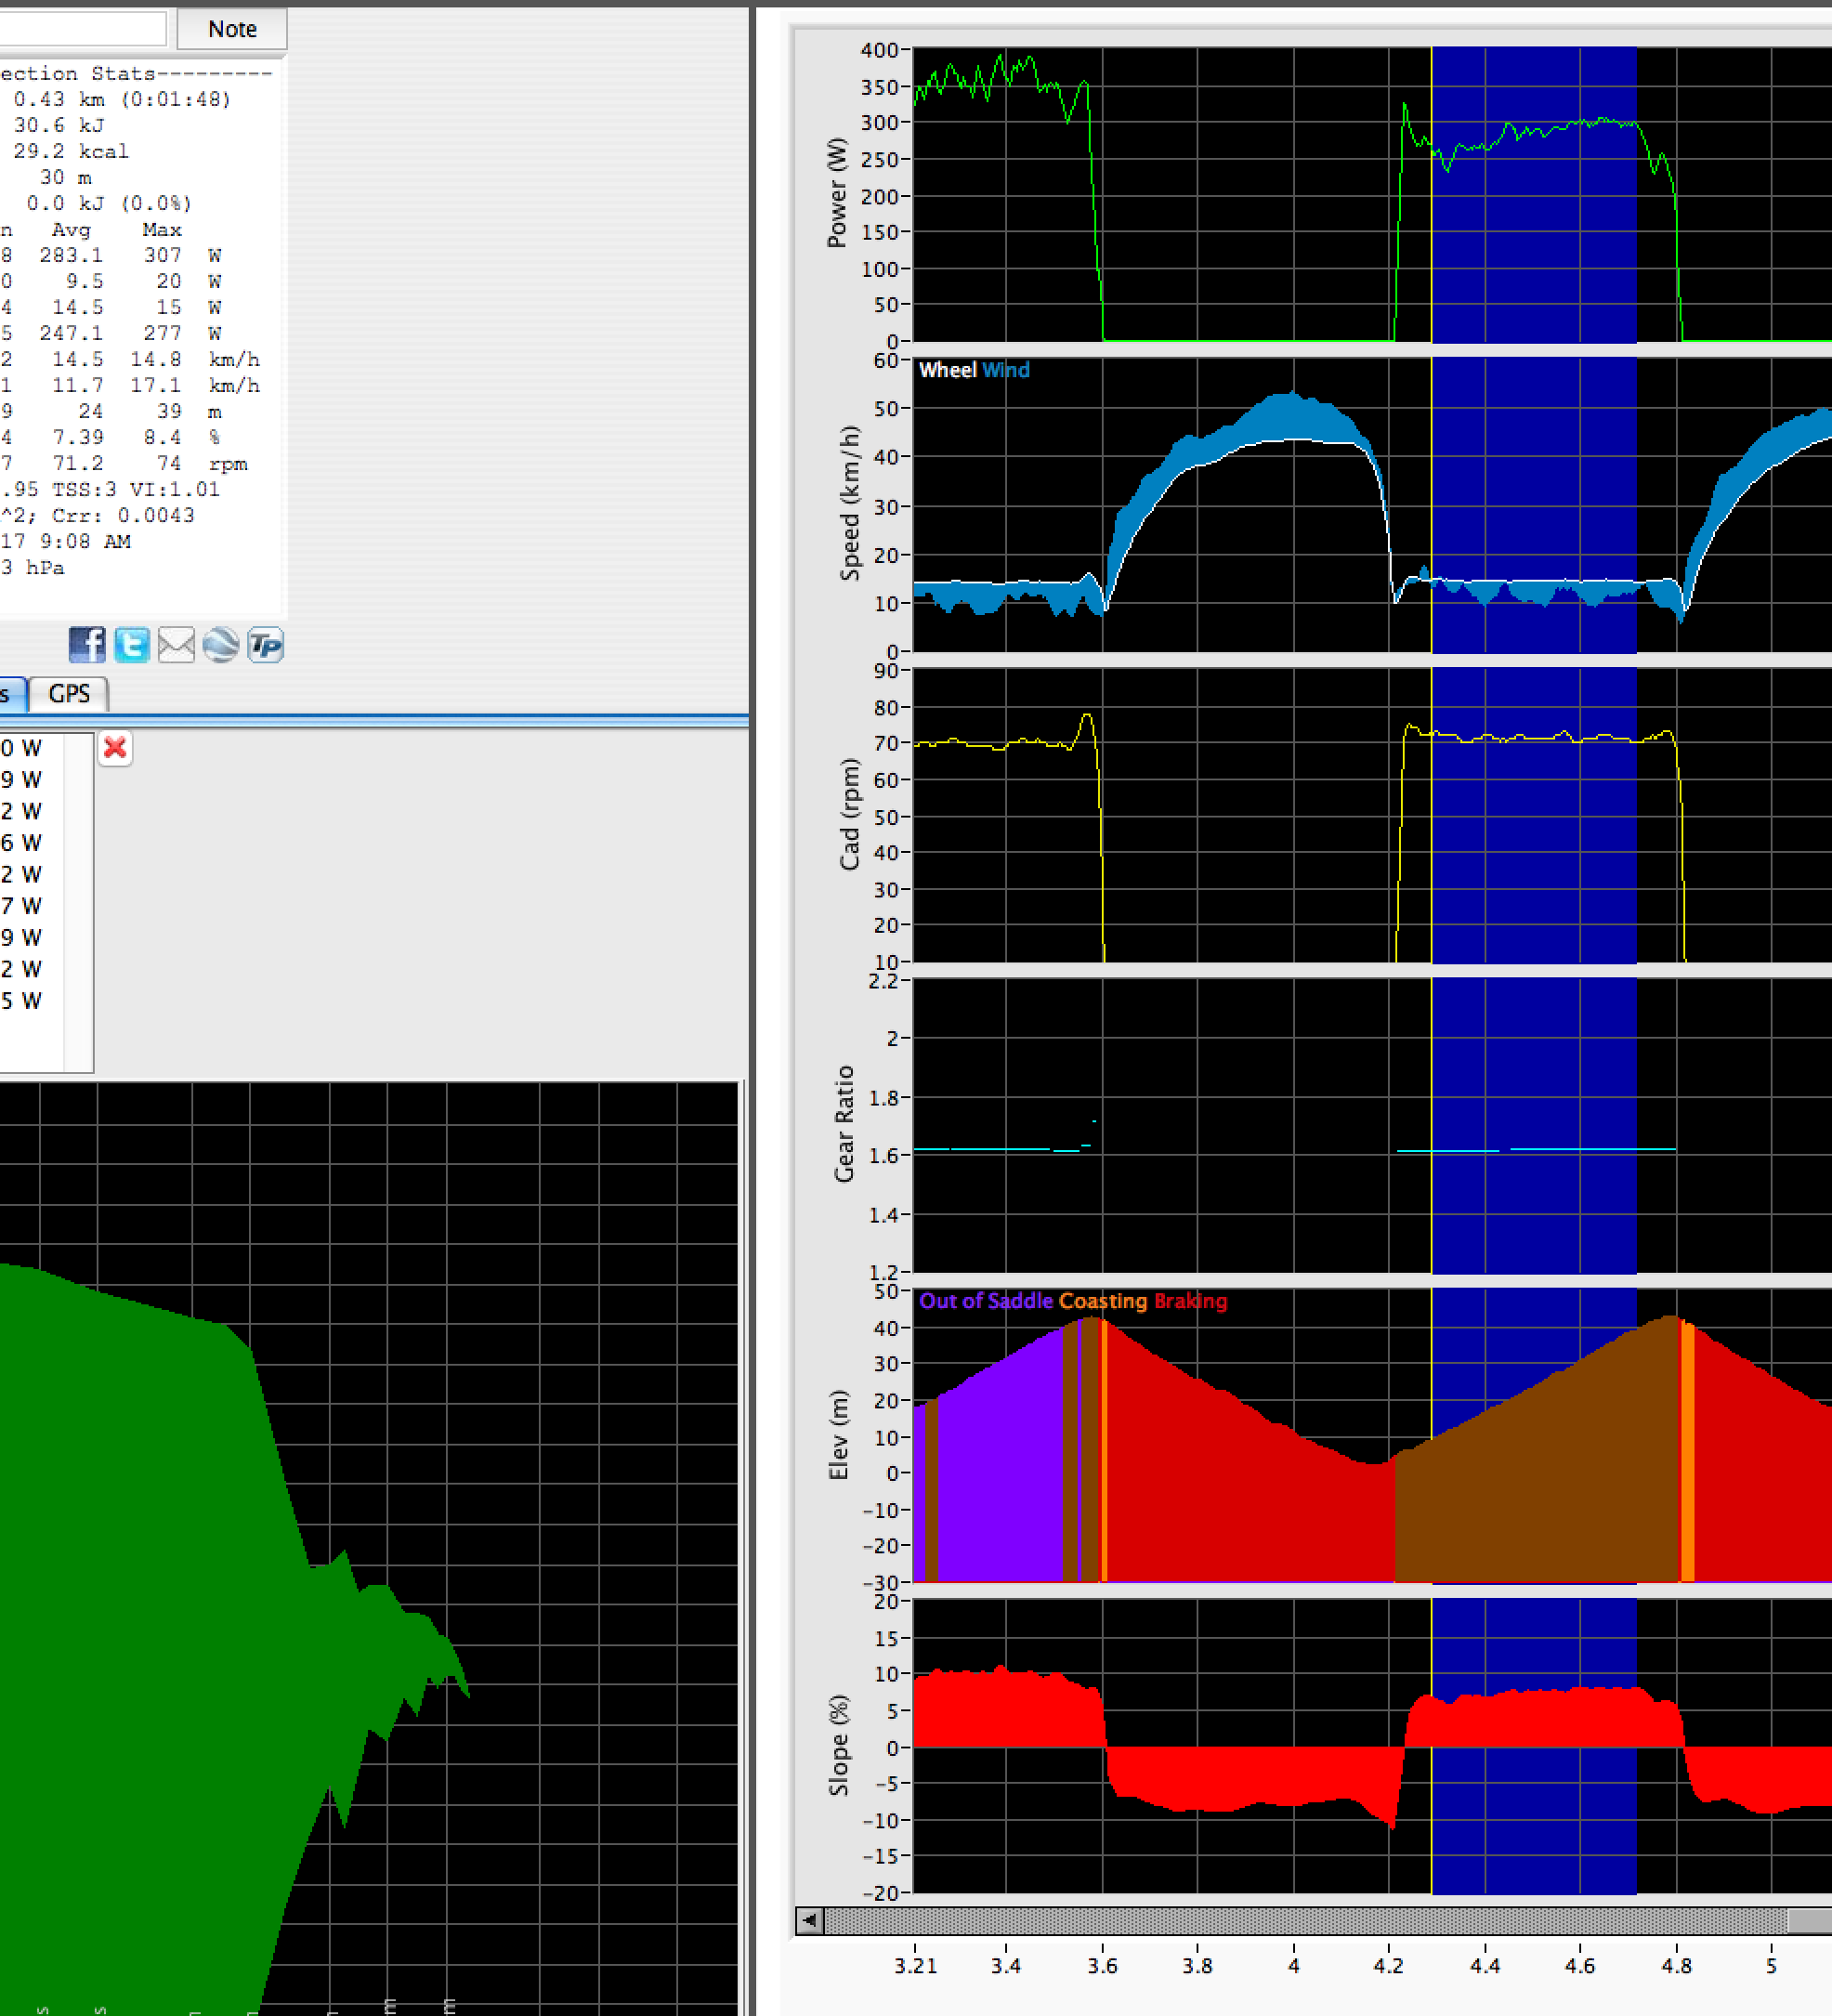
- Out-of-saddle PowerStroke
- Screen Shot 2017-08-13 at 2.09.13 PM.png (320.91 KiB) Viewed 27379 times
For your three, In-the-saddle efforts (hills 1,3 and 5), PP measures:
Hill 1: 30 m climb, a 7.57% slope (note there is some bumpiness in watts near the top of the climb).
Hill 3: 30 m climbed, over a distance of 430 m, or a 7.39%. Very smooth watts
Hill 5: 30 m climb, 7.38% slope. Very smooth watts
Hill 1 has some variation in watts near the end, but hill 3 and 5 are very, very smooth.
So, for PP, I've used 30 m rise (from baro sensor), 430 m length (from speed sensor), and 7.385% slope (from accelerometer, hills 3 and 5)
Using the baro sensor and speed sensor data, you climbed 30 m over 430 m, which yields a slope of 7.0%, somewhat lower than the 7.385% slope measured by the accelerometer.
But here's the thing:
if the distance climbed were measured to be 31.7 m, instead of 30 m, PP and baro slopes would be identical.
For baro elevation readings to be precise, the pressure inside PP case needs to be identical to the outside pressure. Under conditions of rapidly changing pressure (which happens on any steep climb), it takes about 5 seconds for internal and external pressures to equalize;
consequently, the baro sensor elevation will lag behind actual elevation changes.
You climb 30 m in about 107 seconds.
Each 5 seconds you climb about 1.4 meters. So, what may be happening here is that the baro elevation/slope readings are not updating fast enough to keep up with the accelerometer slope readings.
I think we agree that your out-of-saddle riding is causing high accelerometer readings. And my view is that the in-saddle accelerometer, slope and power readings are correct.